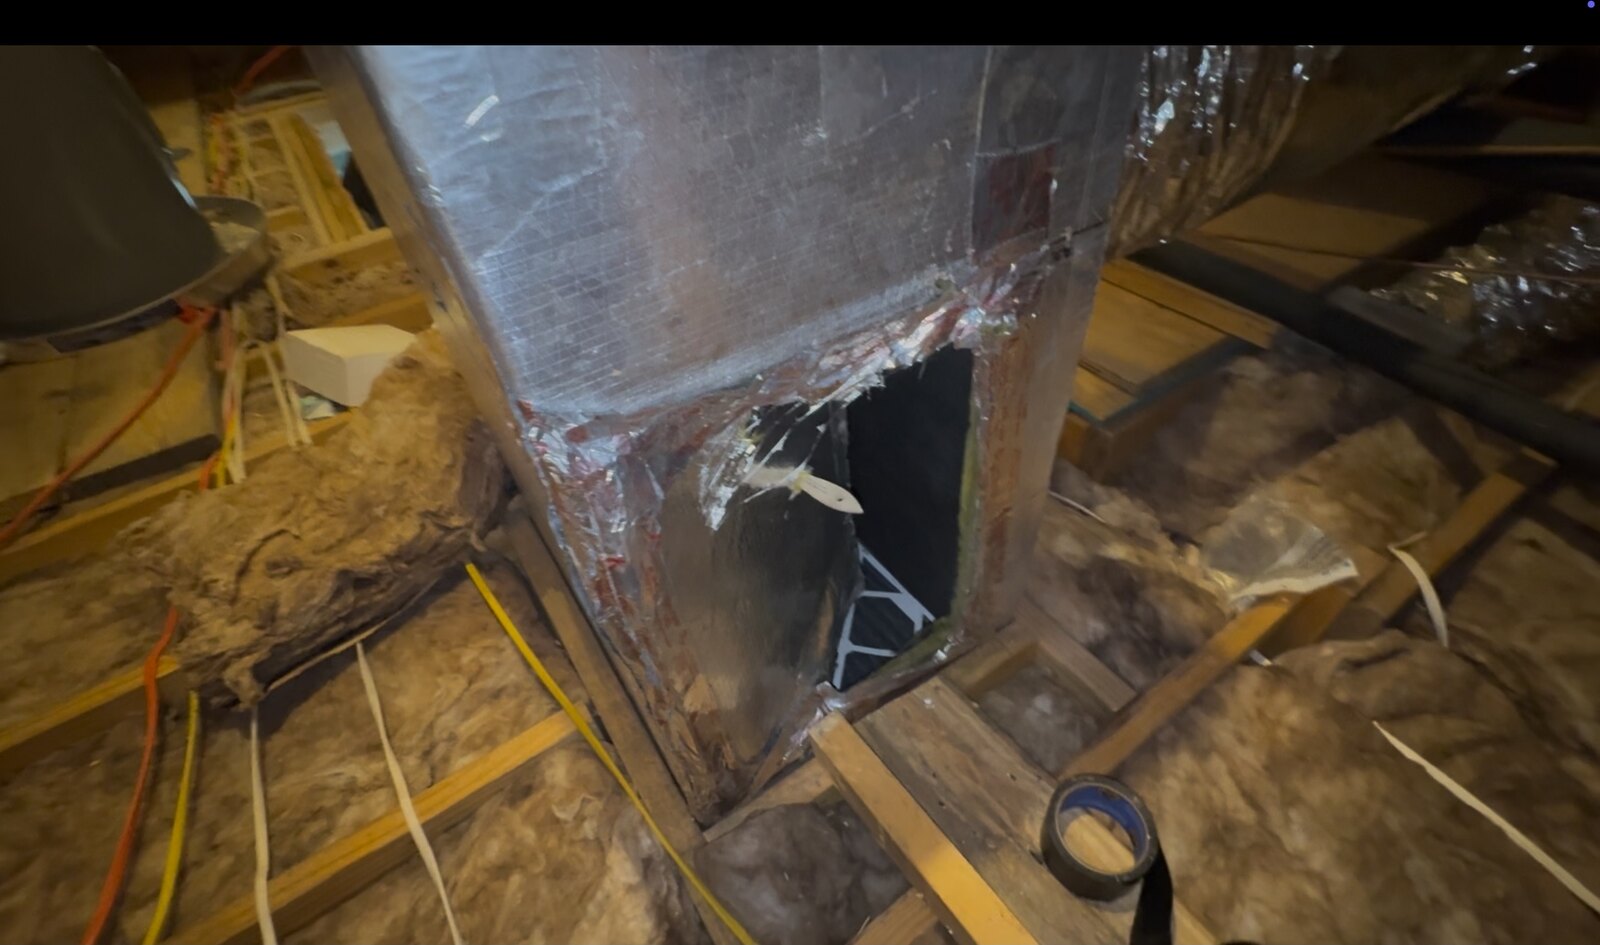
The supply-leak story is well told. A hole in a supply trunk in an attic pushes conditioned air out of the house, the house goes slightly negative, and hot humid outdoor air comes back in through every crack to make up the difference. Every home-performance article on duct leakage tells that story, and it is correct.
The return-leak story is told less often, and it is a worse story. A hole on the return side of an air handler in an attic doesn't push conditioned air anywhere. It pulls the attic — its temperature, its humidity, its dust — into the return plenum, where it joins the air coming back from your rooms. The two travel together through the filter, across the blower, and into the evaporator coil as one mixed stream. The house doesn't go negative. It goes positive, because the fan is now moving more air than the returns are pulling from the rooms. And the capacity you paid for gets used up cooling and drying the attic instead of the bedrooms.
The two holes photographed in this article are the reason I finally sat down to write out the numbers. Both were shot on New Orleans jobs this summer. The first is the rectangle above, roughly ten inches wide and twelve inches tall. The second — down the page — is a hole about seven inches across on the same kind of plenum, right underneath the "R-8" label.
Admittedly, these two photographs are not the typical find. They are the dramatic end of this problem, not the common end. I put them in because they are easy to see and impossible to argue with. The version I find in most houses is far less photogenic — a closet air handler with a couple of unsealed penetrations in the wall cavity behind it, or an attic plenum whose seams were never properly taped, adding up to maybe four square inches of open area total. Nothing you would take a picture of. That is the case worth understanding, and it is the reason there is a chart further down that lets you dial the opening size yourself.
The question either way is: what does an opening like that actually cost you, in cooling that reaches the register? Worked all the way through, the answers are larger than almost anyone in the trade expects. Four unremarkable square inches costs about 9% of a three-ton system's delivered cooling on a design day. A four-by-four-inch hole costs about a third. The photographed seven-inch hole erases roughly 73%. The ten-by-twelve above drives delivered capacity below zero. Every one of those numbers comes from a model calibrated against a psychrometric-room experiment run by Texas A&M, and every one is reported as an upper bound with a stated ±3-point band. If you want the equations and the validation table, they are in Check the math at the end; the body of the article stays in plain language.
Where the money goes: the four losses
Before the numbers, a frame. Every ton of cooling on the nameplate of a residential air conditioner has to survive four losses before it gets to your rooms. Manual J sizes the unit; Manual D delivers the air; the losses live in between. In order of where they happen:
- Duct thermal loss — the ducts run through an unconditioned attic, and both the supply and return ducts trade heat with attic air through their insulation. NREL puts this at 10–45% for typical residential installations. The looser the duct-jacket seams, the longer the run, and the hotter the attic, the higher the number.
- Supply leakage — cool, dry air escaping the ducts before it reaches a register. Every dollar of that air is a dollar spent conditioning your attic.
- Return leakage — attic air being pulled into the return duct before it reaches the coil. This is what the article is about, and it's the loss the trade talks about least.
- Coil and blower performance — the coil derates when the outdoor unit is hot, when the entering wet-bulb is high, and when the filter is dirty. Fan heat adds back a little sensible load.
Return leakage is the one the trade under-tells because it's the least visible. A supply leak in the attic will sometimes cool a spot on the attic floor enough to leave a stain in the dust. A return leak leaves no such mark. It just quietly runs the coil against 125-degree attic air carrying more than twice the moisture of your living room, eight hours a day, all summer.
What the hole actually does, in three steps
Turning an opening into a capacity loss is not exotic. It takes three steps, and you can follow every one of them without doing any math yourself. The equations are parked in Check the math at the end, along with the laboratory data I checked them against.
Step 1 — the hole passes air, and the fan speeds up
An opening in a return plenum behaves like a sharp-edged orifice with the air handler's fan pulling across it. How much air it passes depends on two things: the area of the opening, and how hard the fan is pulling. Two details separate a right answer from a plausible-looking one.
The pull is not a fixed number. The common shortcut is to assume the return side sits at some standard suction and compute the leak from that. It badly over-predicts what a large hole is doing, because a large hole unloads the fan and collapses the very suction that drives it. On the ten-by-twelve above, the return-side pressure falls to roughly a third of its design value. The honest way to solve it is to find the single pressure at which the fan, the ducts, and the leak all agree on airflow at once.
Total airflow goes up, not down. This is the part that catches people. The cases in this article assume a fixed-speed PSC blower on a set torque curve — unload the return side and it will cheerfully move more air. It is just no longer moving your air. A sealed three-ton system moves about 1,200 CFM, and every bit of it came back from your rooms. Add the seven-inch hole and total flow rises slightly, to about 1,265 CFM — but 254 CFM of that is now attic air, joining the return stream and crossing the coil right alongside it. One-fifth of everything the coil sees never came from inside the house.
So if somebody tells you a return leak "reduces airflow to the coil," they are describing an ECM system, or one with a badly undersized return. On a fixed-speed system with reasonable ducts, a return leak raises total airflow across the coil while lowering the share of it that came from your rooms.
Step 2 — what the air at the coil looks like
Once you know how much air is coming from where, you just mix it. With the plenum sealed, the coil would see nothing but 75 °F house air — one temperature, one moisture content, which is exactly what the Manual J load calculation and the manufacturer's capacity tables were both built around. With the hole open, it sees a weighted blend of that 75 °F room air and attic air at 125 °F carrying well over twice the room's moisture. For the seven-inch hole, that blend is 80% room air and 20% attic air, and it arrives at the coil like this:
Temperature entering the coil: 85 °F. Ten degrees warmer than the Manual J load calculation assumed.
Moisture entering the coil: about 23% more water vapor than the room air. The coil has to wring all of that back out before your house sees any humidity control at all.
Coil loading: above its rating. A residential coil is rated at a 67-degree entering wet-bulb; this blend pushes it past that point, which is a regime the published capacity tables were never meant to cover.
On the ten-by-twelve, it stops being a near-miss. The coil sees 97 °F entering air carrying about 50% more moisture than the room. No residential coil sold with a rated capacity envelope is built to handle that.
Step 3 — the coil cannot make it back
Here is where most published analysis of return leaks goes wrong, and it is worth understanding even if you never touch the equations.
The tempting assumption is that a coil handed hotter, wetter air simply produces proportionally more cooling to match — that capacity scales up with the load you throw at it. It does not. The total cooling a system can produce is set on the refrigerant side — by the compressor, by the condenser, and by how hot it is outdoors. It rises only slightly when the entering air gets warmer and wetter, and it falls when the outdoor unit gets hot. It has no idea there is a hole in your plenum, and it does not rise to meet one.
So the extra heat and moisture the hole is feeding the coil does not get handled by extra capacity. It gets subtracted from the capacity that was supposed to go to your bedrooms. That is the whole mechanism of this article in one sentence.
It is worth sitting with the bookkeeping, because it is the part that makes the size of these losses believable. On the seven-inch hole, the coil is not producing less cooling than its nameplate. Handed hotter, wetter air, it produces about 40,100 Btu/h — roughly 11% more than its 36,000 Btu/h rating. But of that output, about 31,600 Btu/h goes into cooling and drying the 254 CFM of attic air the hole is feeding it. Fewer than 9,000 Btu/h are left over for the air that actually came from your house. The machine is working harder than it was designed to and air-conditioning your attic with the difference.
The difference between doing this step the easy way and the honest way is not academic. On the seven-inch hole, the shortcut says 11% of capacity is lost. The corrected physics says 73%. That is a factor of nearly seven. If you have seen single-digit loss figures for return leaks in the trade press, you were looking at the shortcut — and that is a fair part of the reason nobody in the chain treats this defect as urgent. The number they were shown was too small to bother with.
The two photographed holes
Both cases below are the same machine: a three-ton system with a fixed-speed blower rated at 1,200 CFM, on a New Orleans design day — 95 °F outdoors, attic at 125 °F, room held at 75 °F and 50% humidity. Sealed, that system delivers about 33,400 Btu/h to the registers, at a 21-degree temperature differential* — 75-degree room air in, 54-degree supply air out. Every number below is measured against that.
Photo 2 — the seven-inch round hole
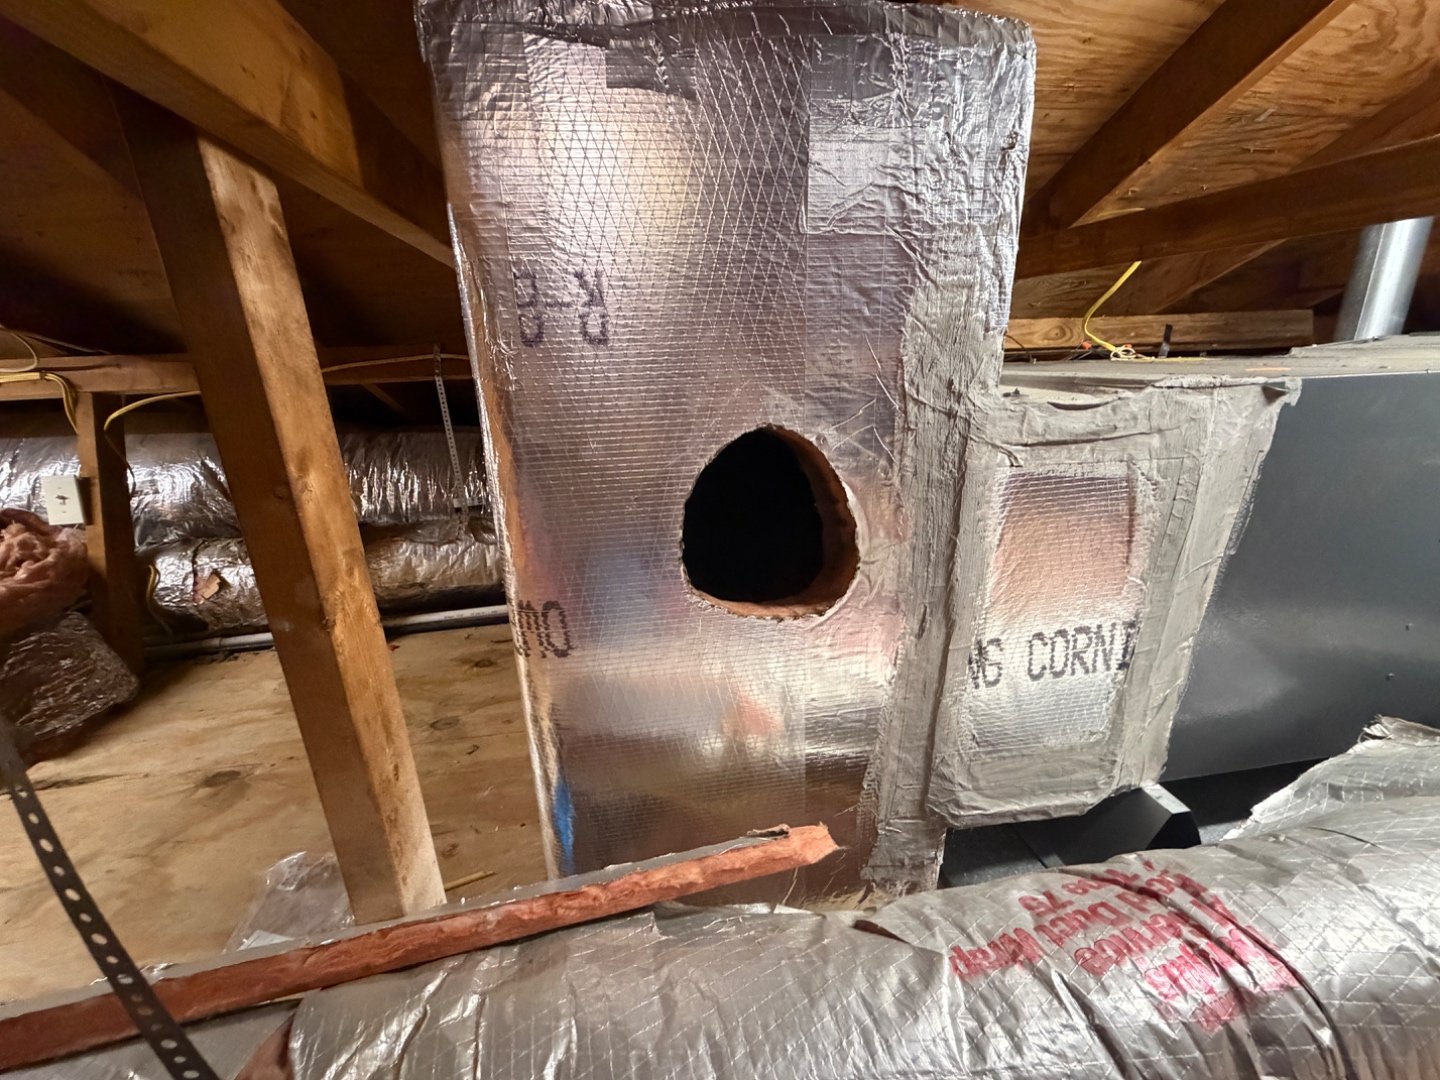
- One-fifth of the air crossing the coil is attic air — 254 CFM of a 1,265 CFM total.
- The register differential collapses from 21 degrees to 13. The air leaving your vents is eight degrees warmer than it should be, and it is not moving any faster to make up for it.
- Delivered cooling drops by about 73% (upper bound, ±3 points). A three-ton system is putting out less than three-quarters of a ton.
- The supply air is now wetter than the room — roughly 14% more water vapor than the air already sitting in the bedroom.
That last point deserves a moment, because it is the mechanism behind the single most common complaint I get called about: "I run the air conditioner and the house still feels sticky." On a design-condition day, a system with that hole is not merely cooling inefficiently. It has crossed over into actively adding moisture to the house every hour it runs. The registers have stopped drying and started humidifying. (The sensible-heat math behind that claim is in Check the math.)
Photo 1 — the ten-by-twelve rectangle
This is the photograph at the top of this page — the plenum with the paintbrush parked in it. Roughly 120 square inches of open area, better than three times the seven-inch hole.
- Nearly half the air crossing the coil is attic air — 567 CFM of a 1,290 CFM total.
- The register differential collapses from 21 degrees to about 5. Hold your hand over the vent and it barely reads as cool.
- The supply air carries roughly 50% more moisture than the room.
- Delivered cooling goes below zero. Not "very low." Negative.
Negative delivered capacity is not a rhetorical flourish, so let me say exactly what it means: on a design-condition day, running that air conditioner leaves the house hotter and wetter than leaving it switched off. I checked whether that was just an artifact of the thermostat setpoint by letting indoor temperature drift upward in the model. At 78 °F it is still negative. At 82 °F, still negative. At 88 °F, still negative. There is no indoor temperature at which that system cools that house.
And that is a healthy system. Correct size, correct charge, clean coil, working compressor. One duct defect.
What the far end of this looks like
Both photographs above are cut or torn openings in an otherwise intact plenum. There is a worse category, and I run into it often enough to include it: return boxes that have simply collapsed or pulled away from the air handler. Nothing was cut. The box failed, or the connection was never mechanically fastened in the first place, and the ductboard sagged off the cabinet under its own weight.
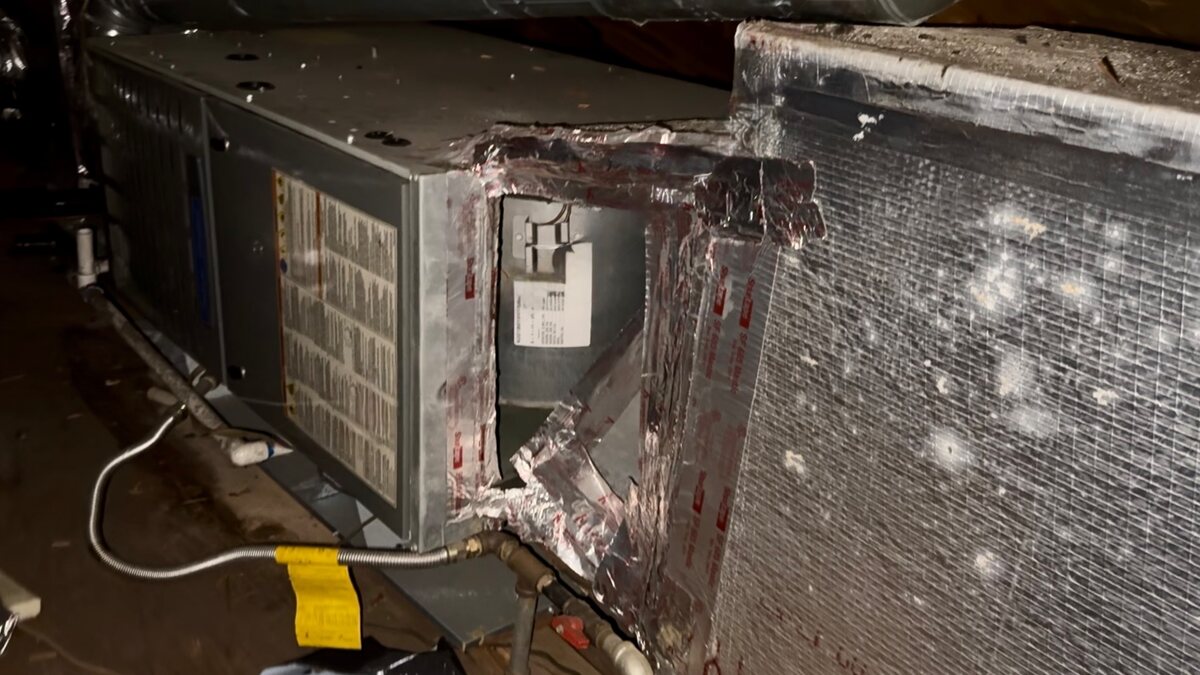
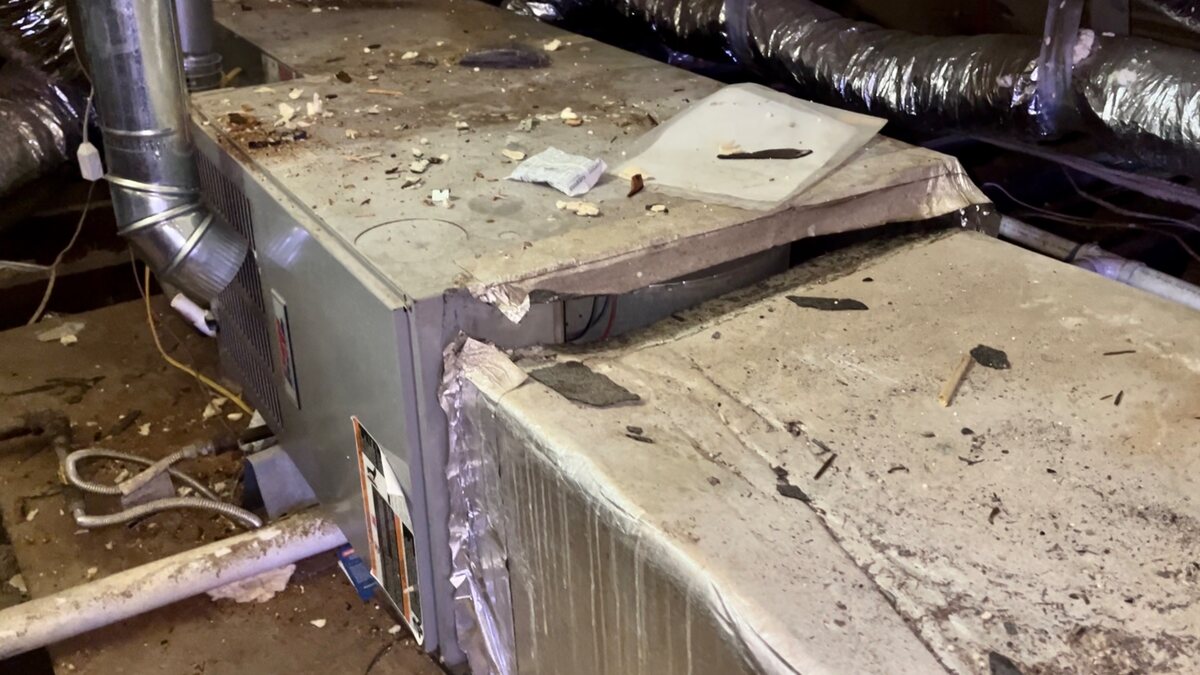
I include these two because they are the pictures that end an argument. But I want to be honest about frequency: this is not the common case, and if you go looking for something this obvious you will miss the thing that is actually costing most houses their capacity. The common case is four square inches you would walk past. That is what the next chart is for.
So how big does the hole have to be before it matters?
Less big than you would think, and that is the practical finding of the whole article. Below, pick an opening size and watch what it does to the same three-ton system on the same design day. It opens on four square inches, because that is the case most houses actually have.
Delivered capacity vs. return-plenum open area
Three-ton system, 1,200 CFM rated, fixed-speed blower. 95 °F outdoors, attic 125 °F, room held at 75 °F and 50% humidity. Pick an opening size:
Every size at once — share of cooling that reaches your rooms
Every figure here is produced by the model described in Check the math, not estimated. All of them are upper bounds carrying a ±3-point band, because the model runs 2.4 to 6.5 points high against the Texas A&M laboratory cases. Duct thermal loss and supply-side leakage are deliberately excluded, which means a real house with one of these openings does worse than the chart says, not better.
Three things in that chart are worth making special note of.
Four square inches costs you about 9%. Four square inches is a two-by-two-inch gap, or a handful of untaped seams behind a closet air handler. No homeowner would ever call about it, no technician would write it up, and it is quietly taking a tenth of the cooling off the top.
A four-by-four-inch hole costs you a third, and it is roughly where the supply air stops drying your house. At sixteen square inches, the moisture leaving the registers matches the moisture already in the room. Below that size the air conditioner is dehumidifying. Above it, it isn't — and the house starts feeling clammy at a thermostat setting that used to be comfortable. That crossover is the single most useful thing on the chart, because it explains a symptom people actually notice.
The curve is steepest at the small end. Doubling from four to nine square inches roughly doubles the loss. Going from 64 square inches to 144 barely changes the answer, because by then delivered capacity is already below zero and the house is losing either way. The damage is concentrated in the sizes nobody inspects for.
The literature already said this
Numbers this large deserve suspicion, so I checked them before publishing rather than after — and the uncomfortable finding is that they are not the aggressive end of what is already in print. They are the middle of it. A 1996 Texas A&M psychrometric-room experiment on exactly this defect is the closest thing the problem has to a controlled test, and the model here reproduces its humid-attic cases to within 2.4 to 2.7 percentage points (O'Neal, Davis, Rodriguez and Kondepudi). That paper also cites Cummings and Tooley's Florida field work, which put a 15% return leak from a hot attic at "50% or more" of the air conditioner's capacity — and at 20% leakage from a 130-degree attic, at capacity that "may be reduced by 95%." The Florida Solar Energy Center publishes the 15% case as about 50% as well, and the National Comfort Institute's field measurements say the same thing more bluntly: attic return leaks "often reduce system delivered capacity by 50% or more" on hot afternoons.
So the 73% figure for a 20% leak is bracketed on both sides by published work, and sits below the only number I can find at matching conditions. The comparison table, the calibration factor, the honest limits of the extrapolation, and both equations are in Check the math.
What this doesn't include
Two things are deliberately outside this analysis, and it's worth naming them so the numbers aren't over-interpreted.
Duct thermal loss. NREL's Building America work on ducts in hot-humid climates puts total duct thermal losses and gains at 10–45% of heating and cooling load, and notes that even properly sealed and insulated duct systems "commonly account for approximately 10%." That is real, and it is stacked on top of everything here. The article's numbers assume perfectly insulated ducts — which of course don't exist. In a typical New Orleans attic with R-8 ductboard, the seven-inch hole's actual delivered-capacity number is worse than the 73% quoted here, not better.
Supply-side leakage. If you've got a return leak, you likely also have supply leaks — same crew, same era, same attic. Supply leaks compound the loss in a different way (they pressurize the attic and push conditioned air out of the house rather than pulling attic air in), and stacking them onto a return-leak number without measuring both would hide which defect is worth fixing first. Each has its own tool. This article is about return-side leakage as an isolated defect.
What to do about it, in one paragraph
A photograph is enough to identify the defect. Fixing it is mastic and mesh, or a proper metal patch, and about an hour of a competent tech's time. The unglamorous truth about this class of problem is that the fix is trivially cheap compared to what the defect costs. A seven-inch hole erasing $1,500 a summer of paid-for cooling gets fixed for $75 in materials. The reason it doesn't get fixed is not cost. It's that nobody in the chain — the installer, the service tech, the homeowner — was ever taught that this specific defect matters. The article is here so you don't have that excuse anymore.
A Practical Home Performance diagnostic will find return-side leakage the way it should be found: by measuring return-plenum static pressure with the fan running, and by walking the attic with a light. The number the diagnostic returns is not a percentage of nameplate — it's a delivered-capacity number, in tons, at the register. That's the number a homeowner can act on.
Common questions
Isn't a return leak the same as opening a window? Wouldn't that at least cool the attic?
No. Air leaked into a return plenum from an attic is not the same as air deliberately brought in for ventilation. It's uncontrolled outdoor air at attic conditions, drawn continuously whenever the fan runs, and it hits the coil before the room does. It cools some of your attic — a place you weren't paying to condition — while starving your rooms.
Wouldn't a bigger air conditioner just make up for it?
Only in the sense that it would run more of the time, which means more attic air being dragged through the coil per day. The right fix is to close the hole, not to buy a larger system to compensate for it. Oversizing to compensate for a duct defect is the classic move that installers still make, and the sequel is a house that never quite dehumidifies.
How do I know if my system has this problem?
Three symptoms are worth checking together: the house feels sticky even when the AC is running; the return plenum is in the attic (very common in Gulf South slab-on-grade housing); and one or more rooms are consistently warmer or muggier than the thermostat says. Any single symptom means something else could be wrong. All three together, in a house with an attic air handler, and it's return-side leakage until proven otherwise.
How large a hole does it take to matter?
Much smaller than you'd guess, and this is the answer that surprises people. Four square inches — a two-by-two-inch gap, or several untaped seams adding up — costs a 3-ton system about 9% of its delivered capacity on a New Orleans design day. A four-by-four-inch hole costs about a third. There is no size that is genuinely negligible. The damage grows faster than the area because a bigger opening both admits more attic air and raises the share of total airflow coming from the attic, and those two effects compound.
Bringing it back to the number that matters
The whole point of the Delivered capacity work at Practical Home Performance is that the tonnage on your nameplate is a laboratory number, not a house number. National Comfort Institute's field measurement program, which has been running for more than two decades, puts the average residential system at 57% of nameplate delivered to the register. Return-side leakage — of the kind in the photographs above — is one of the biggest single reasons that number is 57 and not 90.
The article's numbers are meant to make that abstract 57% concrete. When somebody quotes you 43% loss "in typical residential systems," it doesn't mean every system is losing 43% smoothly across all four failure modes. It means some systems are losing 15% and running well, and some systems have one duct defect that is costing them 73% by itself. This article is about that second kind of system. The first kind is what a competent installer produces. The second kind is what most attics contain right now.
If you want the return-leak numbers on your own system, a diagnostic is the way to get it. If you just want to see the numbers move with your own inputs, the return-leak calculator is in the queue — it'll ship publicly once its test file is green against the same five TAMU cases in the table in Check the math below.
Check the math
Everything from here down is the working. You do not need any of it to act on the article — but if you are a contractor, an engineer, or a homeowner who does not take a number on faith, this is where the numbers come from and where you can push back on them.
The two equations
Step 1 — flow through the opening. An opening in a return plenum is treated as a sharp-edged orifice:
Qleak = 4005 · Cd · A · √ΔP Qleak in CFM. A is the open area in square feet. ΔP is return-side static pressure in inches of water column. Cd is the discharge coefficient: 0.65 for a clean sharp-edged cut in ductboard or sheet metal, 0.55 where insulation or framing partly obstructs the opening.
The important part is not the equation, it is that ΔP is solved, not assumed. A large opening unloads the fan and collapses the suction that drives the leak, so assuming a fixed design pressure over-predicts flow badly. On the ten-by-twelve case the return-side pressure falls from a design −0.20 in. w.c. to about −0.07. The model iterates until the fan curve, the duct system, and the orifice flow all agree on airflow at a single pressure.
Step 3 — gross capacity on the refrigerant side. This is where most published treatments of return leakage go wrong. Total capacity is not scaled up by the entering air condition; it is set by the equipment:
Qgross = Qrated · [1 + 0.020 · (EWB − 67)] · [1 − 0.006 · (Toutdoor − 95)] EWB is entering wet-bulb temperature in °F, referenced to the 67 °F rating point. Capacity rises about 2% per degree of entering wet-bulb and falls about 0.6% per degree of outdoor temperature above 95 °F.
The leaving-air state is then solved from a coil energy balance rather than assumed: apparatus dew point is iterated until enthalpy closes, at a bypass factor of 0.12, with fan heat of 365 W per 1,000 CFM subtracted from the delivered result.
The alternative — assuming a fixed 55 °F apparatus dew point and computing leaving air from it — is the shortcut that produces the single-digit loss figures you see in trade press. It is defensible when the coil is loafing near its rated point and wrong once the coil is pushed past rating, which is exactly the condition a return leak creates. On the seven-inch hole, the shortcut returns 10.8% capacity lost. Solving the energy balance honestly returns 73.5%.
Calibration, stated once
Run uncalibrated, the model returned 35,373 Btu/h for the Texas A&M baseline case, against 37,663 Btu/h measured. That is a 6.5% low bias on total capacity, so a single calibration factor of 1.0647 is applied across the whole model, set once against that baseline. It is not tuned per case, and it is not adjusted to make any other result land where I would like it to.
Validation against the laboratory cases
PHP model vs. Texas A&M psychrometric-room measurement
| Attic condition | Vapor | Leak | Model % lost | Measured % lost | Error |
|---|---|---|---|---|---|
| 130 °F, 10% RH | 67 gr | 13.0% | 24.2 | 19.2 | +5.0 |
| 150 °F, 10% RH | 113 gr | 9.1% | 32.3 | 25.8 | +6.5 |
| 150 °F, 14.2% RH | 162 gr | 9.1% | 42.2 | 39.5 | +2.7 |
| 140 °F, 16.8% RH | 149 gr | 7.7% | 30.7 | 28.0 | +2.7 |
| 130 °F, 20% RH | 136 gr | 9.1% | 30.7 | 28.3 | +2.4 |
Two honest readings of that table.
The model runs high. It over-predicts damage by 2.4 to 6.5 percentage points across all five cases, in the same direction every time. That is why every figure in this article is labelled an upper bound and quoted with a ±3-point band. A systematic bias in a known direction is far more usable than a model that scatters.
The bias is smallest where New Orleans actually lives. The two worst rows are the 10%-RH cases — 67 and 113 grains per pound is dry, desert-like attic air, and the model is at its weakest there. The three highlighted rows carry 136 to 162 grains, which is a Louisiana attic on an ordinary bad August day, and there the model lands within 2.4 to 2.7 points of measurement. The design cases reported in the body of this article sit in that regime.
Where the seven-inch case leaves the validated range
One limit has to be stated plainly, because it is the weakest point in the whole article. The largest leak Texas A&M actually tested was 13% of system airflow. The seven-inch hole is 20.1%, and the ten-by-twelve is 43.9%. Those two cases are extrapolations past the end of the validated range, not interpolations inside it. Treat the small-opening end of the chart — 4 through 28 square inches — as the part standing on measured ground, and the two photographed holes as the direction the physics points once you go past it.
Two independent checks say the extrapolation is not running away. Scaling the laboratory's measured 39.5% loss by the ratio of leak fraction and attic-to-room enthalpy difference predicts roughly 67% for the seven-inch case, against the model's 73.5% — the same neighbourhood, with the model high, consistent with the bias in the table above. And Cummings and Tooley's field figure for a 20% leak out of a 130-degree attic is a capacity reduction that "may be reduced by 95%" — well above 73.5%. The model sits between a conservative scaling argument and a more severe published field figure, which is about the best position an extrapolation can be in.
For the calculations behind the 73.5% specifically: mixed air enters the coil at 85.0 °F and 82.1 grains per pound, an enthalpy of 33.29 Btu/lb, giving an entering wet-bulb of roughly 69.3 °F. Gross capacity at that entering condition, with the 1.0647 calibration applied, is 40,090 Btu/h — above the 36,000 Btu/h rating, because the coil is being loaded past its rating point. Of that output, 1,143 lb/h of attic air absorb 27.62 Btu/lb, or 31,570 Btu/h, leaving 8,554 Btu/h for the recirculated room air. The house-side balance closes independently: 5,692 lb/h of room air across an 1.88 Btu/lb enthalpy drop is 10,701 Btu/h, less 1,576 Btu/h of blower heat, or about 9,100 Btu/h — against the 8,865 Btu/h the model reports with exact psychrometrics. The two paths agree to within 3%, and the gross-capacity ledger closes to within 0.1%.
Which is the answer to the obvious objection, that a three-ton system cannot possibly behave like a three-quarter-ton system. It is not producing three-quarters of a ton of cooling. It is producing more than three tons and spending 79% of it on the attic. The reason that does not feel impossible in the field is that a house in this condition never reaches setpoint at all — the symptom is not weak air, it is a thermostat that never satisfies.
The sticky-house math
The claim in the body that the seven-inch hole turns the registers into a humidifier rests on the sensible heat ratio — the share of the system's work that goes into lowering temperature rather than removing water. A healthy Gulf South system runs an SHR around 0.78. On the seven-inch hole, modelled SHR at the register is 1.89: the system is producing more sensible cooling than its total capacity, which is only possible if it is adding latent load to the house at the same time.
In grains, which is the honest unit for it: supply air leaves at 74 grains per pound against 65 grains in the room. Nine grains per pound of net moisture, delivered to your bedrooms, every hour the fan runs. Texas A&M measured the same crossover — SHR above 1.0 at high attic humidity with roughly 10% return leakage — which is a large part of why I trust this result rather than treating it as a modelling artifact.
Every case, all columns
3-ton, 1,200 CFM nominal, 95 °F outdoor, attic 125 °F at 150 gr/lb, room 75 °F / 50% RH / 65 gr/lb
| Opening | Leak CFM | Total CFM | Attic share | Coil inlet | Supply | ΔT room–supply | Supply gr | Delivered | % lost | SHR |
|---|---|---|---|---|---|---|---|---|---|---|
| Sealed | 0 | 1,200 | 0.0% | 75.0 °F | 53.8 °F | 21.2 | 56 | 33,427 | 0.0 | 0.78 |
| 4 in² | 32 | 1,241 | 2.5% | 76.3 °F | 55.1 °F | 19.9 | 59 | 30,387 | 9.1 | 0.83 |
| 9 in² | 69 | 1,246 | 5.6% | 77.8 °F | 56.3 °F | 18.7 | 62 | 26,807 | 19.8 | 0.88 |
| 16 in² | 118 | 1,251 | 9.5% | 79.7 °F | 57.7 °F | 17.3 | 65 | 22,082 | 33.9 | 0.99 |
| 28 in² | 197 | 1,260 | 15.6% | 82.8 °F | 60.0 °F | 15.0 | 70 | 14,512 | 56.6 | 1.30 |
| 38 in² · photo 2 | 254 | 1,265 | 20.1% | 85.0 °F | 61.6 °F | 13.4 | 74 | 8,865 | 73.5 | 1.89 |
| 64 in² | 376 | 1,276 | 29.5% | 89.7 °F | 64.8 °F | 10.2 | 82 | −3,193 | 109.6 | −3.90 |
| 120 in² · photo 1 | 567 | 1,290 | 43.9% | 97.0 °F | 69.6 °F | 5.4 | 96 | −22,343 | 166.8 | −0.27 |
| 144 in² | 627 | 1,294 | 48.5% | 99.2 °F | 71.0 °F | 4.0 | 100 | −28,455 | 185.1 | −0.14 |
A note on the negative SHR values in the last three rows: once delivered capacity crosses below zero, the ratio stops carrying any physical meaning — you are dividing by a negative denominator. They are printed for transparency, not for interpretation. The number that matters in those rows is the delivered-capacity column, and it is below zero.
Where the room-temperature check comes from
The claim that there is no indoor temperature at which the ten-by-twelve case cools the house was tested by holding indoor vapor content at 65 grains per pound and letting dry-bulb drift: delivered capacity is −20,691 Btu/h at 78 °F, −17,899 at 82 °F, and −13,754 at 88 °F. It becomes less negative as the room heats up, as you would expect, but it does not cross zero anywhere in the habitable range.
What would change my mind
Three things would move these numbers, and I would rather name them than be caught by them. A measured fan curve for the specific blower instead of a generic PSC torque characteristic would tighten Step 1. A manufacturer's expanded performance table for the specific coil would replace the refrigerant-side correlation with real data and probably reduce the high bias. And field measurement of an actual attic's temperature and vapor content over a full cooling season, rather than a design-day assumption, would tell us how many hours a year any of this is true. Until then: upper bound, ±3 points, stated every time.
References
- O'Neal, D. L., Davis, M., Rodriguez, A. and Kondepudi, S. Effect of Return Air Leakage on Air Conditioner Performance in Hot/Humid Climates. Proceedings of the Tenth Symposium on Improving Building Systems in Hot and Humid Climates, Fort Worth, Texas, May 13–14, 1996. Full paper (PDF).
- Cummings, J. P. and Tooley, J. J. Infiltration and Pressure Differences Induced by Forced Air Systems in Florida Residences. ASHRAE Transactions, Vol. 95, Part 2, pp. 551–560, 1989. Summarised with the 15%-leak figure in Florida Solar Energy Center, Duct Leakage and Air Distribution Systems, FSEC-GP-335-08. PDF.
- U.S. Department of Energy. Energy Conservation Program for Consumer Products: Energy Conservation Standards for Residential Furnace Fans. Final rule, 79 FR 38130, July 3, 2014 — "Compliance with the standards established for residential furnace fans in this rule is required on or after July 3, 2019." Federal Register.
- Falke, R. (National Comfort Institute). NCI Releases System Performance Study Findings. 2006 — the survey behind the 57% figure: "the typical air conditioning and heating system has an initial average CSER or HSER of 57%." PDF.
- Shapiro, C., Magee, A. and Zoeller, W. Reducing Thermal Losses and Gains with Buried and Encapsulated Ducts in Hot-Humid Climates. National Renewable Energy Laboratory / Building America, 2013. PDF.
- Lawrence Berkeley National Laboratory. Duct Delivery Efficiency and Cool-Sense Framework. PDF.
- Walker, I. and Sherman, M. (LBNL) with Abushakra, B. Compression Effects and Field Measurements of Residential Duct Leakage. 2004. DOE OSTI.
- Air Conditioning Contractors of America. Manual D — Residential Duct Systems [ANSI/ACCA 1 Manual D — 2016]. Publisher page.
- Behls, H. ASHRAE Design Guide for Duct Systems. ASHRAE, 2021 (research project RP-1180), ISBN 978-1-947192-40-9. Publisher page.